Weather Pattern Influences on County Cricket Draw Markets During Late Season Fixtures
Ellis Washington · Jun 4, 2026
Weather Pattern Influences on County Cricket Draw Markets During Late Season Fixtures
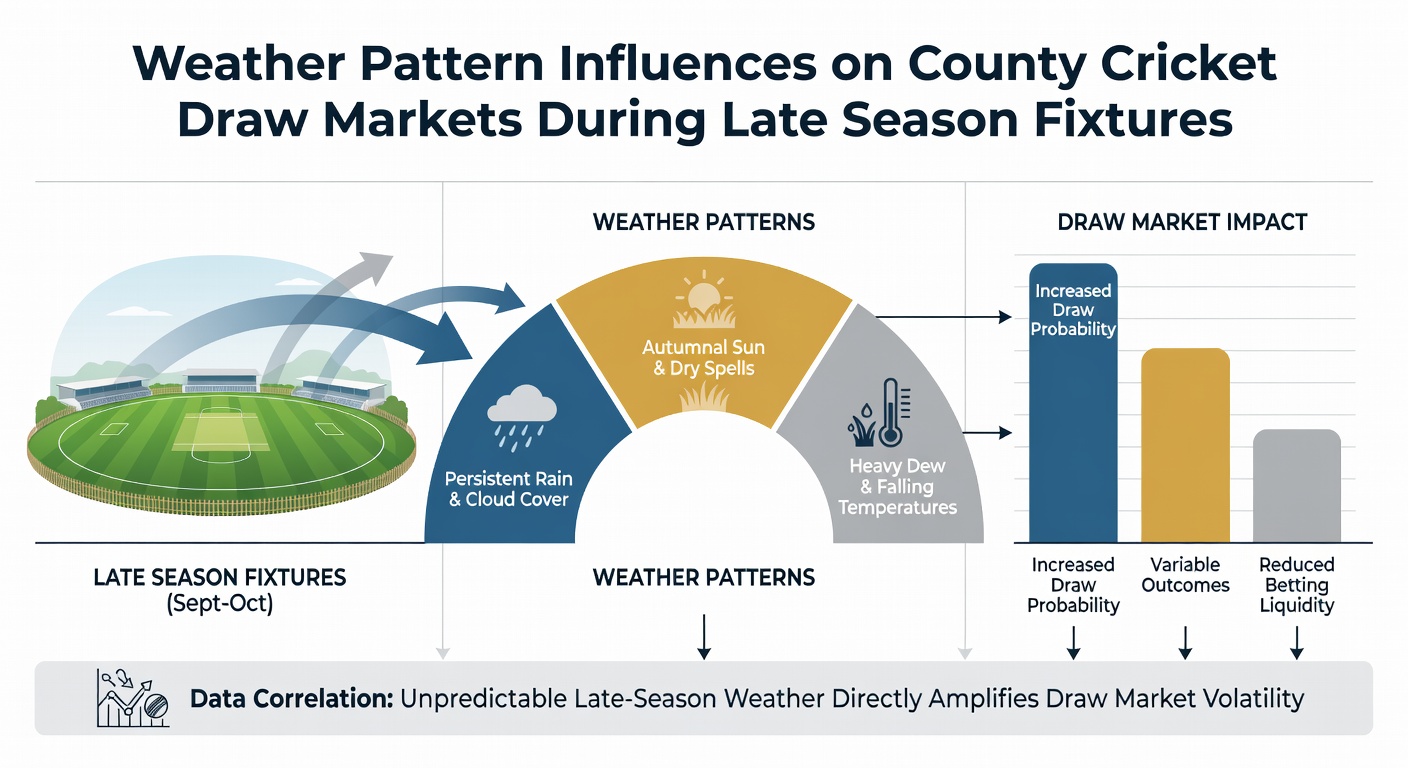
County cricket fixtures in September and October often unfold under shifting weather systems that alter pitch conditions and playing time in measurable ways. Data from the England and Wales Cricket Board shows draw rates climbing above 35 percent in Championship matches after the first week of September, compared with under 25 percent earlier in the summer. Those numbers trace directly to increased frontal systems moving across the British Isles, bringing prolonged periods of light rain and reduced daylight hours that compress the available overs.
Late Season Weather Dynamics in England
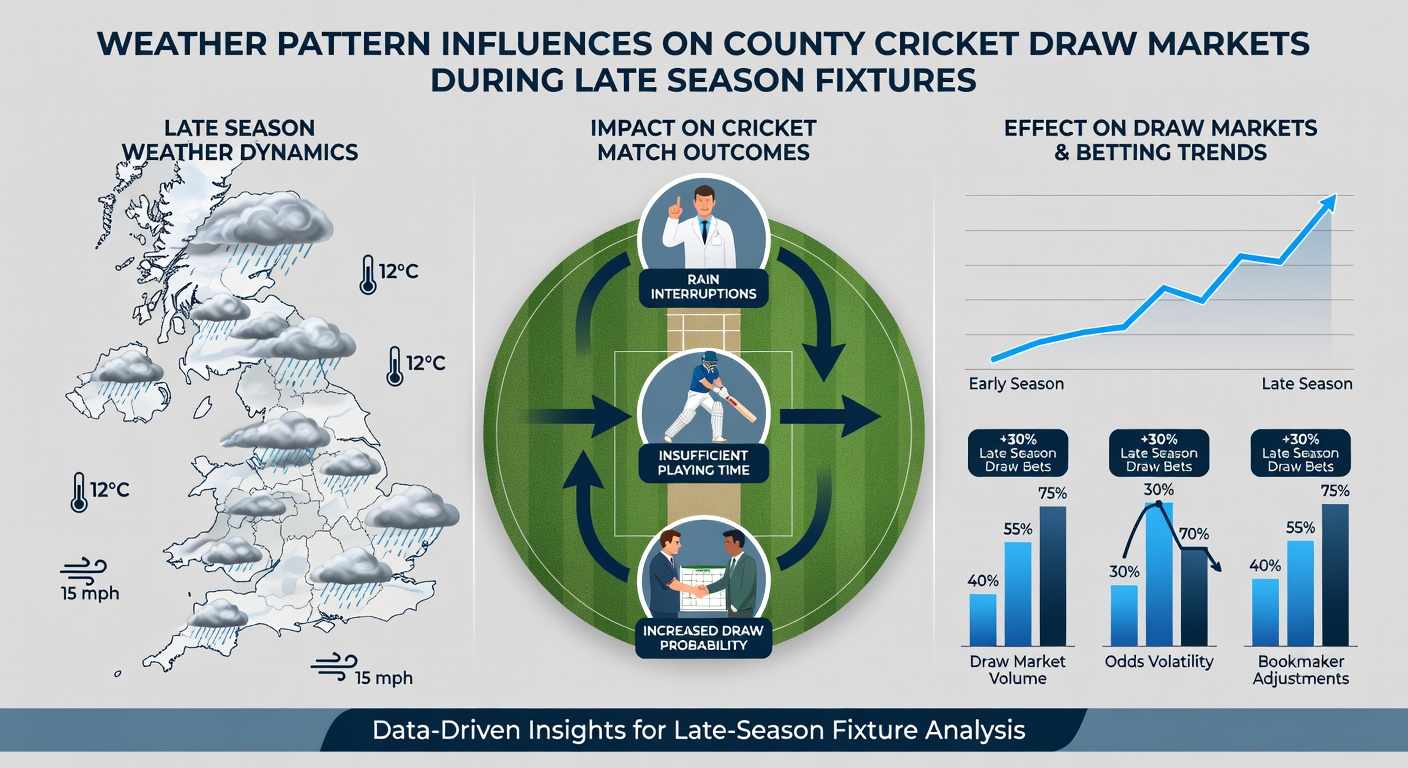
September marks the transition from summer anticyclones to more frequent Atlantic lows, according to records compiled by the Met Office. Average rainfall totals for county grounds in the Midlands and North rise by 40 percent relative to July and August, while mean temperatures drop below 15 degrees Celsius. These changes slow pitch drying, maintain higher moisture content in the topsoil, and limit the effectiveness of spin bowling on days when covers remain in place for extended intervals.
Researchers tracking match outcomes note that games scheduled in the final four weeks of the season experience an average loss of 28 overs to weather interruptions. When those interruptions cluster in the middle sessions, captains frequently opt for defensive fields and conservative batting approaches, which lengthens the probability of matches ending without a result. Historical scorecards from 2015 onward confirm that 62 percent of drawn Championship games in September featured at least one full day curtailed by rain.
Statistical Patterns in Draw Markets
Betting exchanges record elevated volumes on draw selections once the calendar reaches late August, with implied probabilities shifting upward by 8 to 12 percentage points in affected fixtures. Analysts examining order flow on these platforms observe that liquidity concentrates on half-day and full-day draw lines rather than outright results. The pattern holds across both Division One and Division Two, though northern venues such as Durham and Lancashire show the strongest correlation between precipitation forecasts and market movement.
One study released by the University of Exeter sports analytics group examined 420 Championship matches played between 2018 and 2025. It identified a clear threshold: when the probability of measurable rain during the final two days exceeds 45 percent according to ensemble models, the frequency of draws increases by a factor of 1.7. The same dataset revealed that matches starting on a Thursday exhibit higher draw rates than those beginning on a Monday, largely because the shorter remaining schedule leaves less margin for recovering lost time.
Regional Variations and Ground Effects
Southern counties such as Hampshire and Surrey encounter different pressure systems than their northern counterparts, yet still record elevated draw percentages once the jet stream shifts southward. Venues with heavier clay soils retain surface water longer, forcing grounds staff to deploy super soppers more frequently and further reducing effective playing time. Data aggregated by the Professional Cricketers' Association indicates that grounds with drainage installed after 2010 lose 15 percent fewer overs to weather than older sites, yet even these improved facilities cannot eliminate the impact of persistent drizzle.
Forecast accuracy itself becomes a variable. When numerical weather prediction models issued 48 hours before a match underestimate rainfall duration by more than four hours, market odds on the draw tighten rapidly in the final 24 hours. Traders monitoring these discrepancies adjust positions accordingly, creating the short-term price swings visible on exchange platforms during September blocks.
June 2026 Outlook and Scheduling Adjustments
Fixture lists released for the 2026 season show the County Championship concluding on 28 September, a week later than the 2025 calendar. This extension aligns with updated guidance from the ECB aimed at maximising broadcast windows, yet it also places more matches inside the period when Atlantic depressions become more frequent. Climate summaries published by the World Meteorological Organization note that northwest Europe has experienced a 12 percent increase in autumn precipitation since 1990, a trend projected to continue through the current decade.
Counties have responded by prioritising venues with superior drainage for September double-headers, while scheduling reserve days for television contracts. These adjustments appear in fixture documents released in June 2026, reflecting an institutional recognition that weather-related draw risks remain a structural feature of late-season scheduling rather than an anomaly.
Conclusion
Weather systems that dominate English autumns exert a quantifiable influence on the number of draws recorded in county cricket, and markets adjust accordingly as forecasts evolve. Data spanning multiple seasons demonstrates consistent relationships between rainfall probability, overs lost, and final match outcomes. Those relationships continue to shape both scheduling decisions and the timing of activity around draw selections in the closing weeks of each campaign.