Pitcher Velocity Trends During MLB Doubleheaders Unlocking Live Runline Value in Extended Outings
Ellis Krüger · Jun 11, 2026
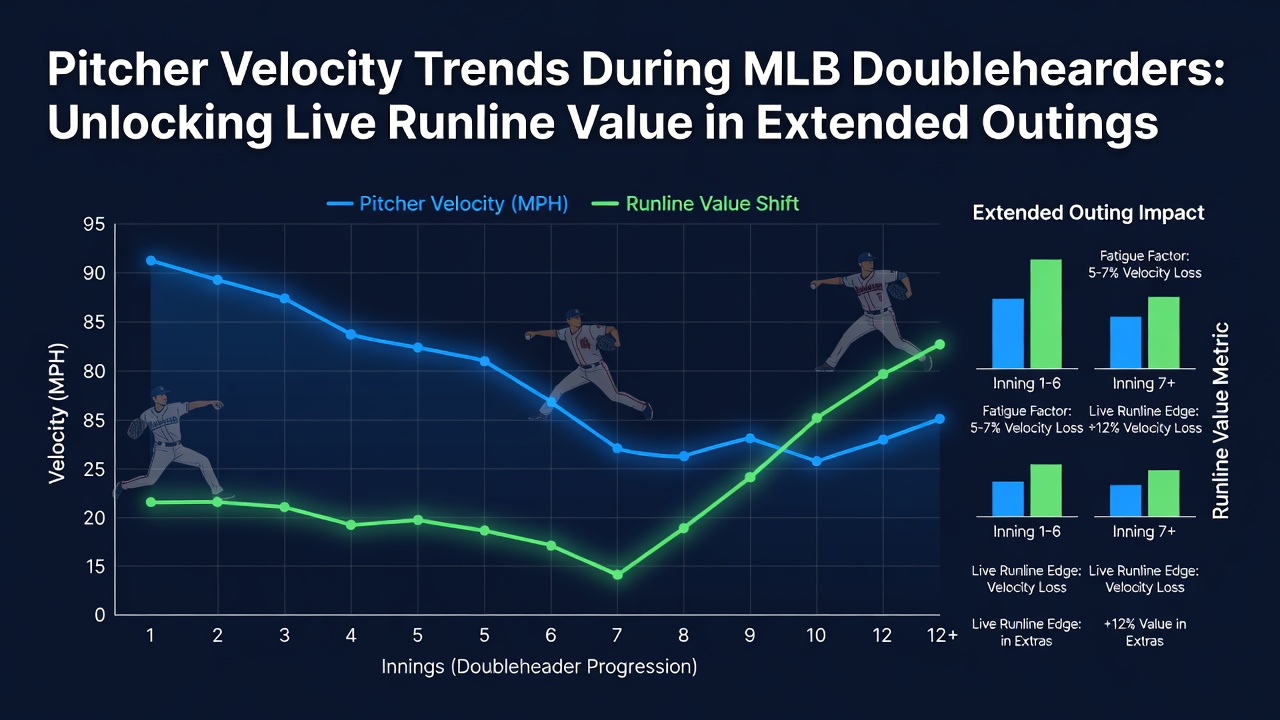
Pitcher Velocity Trends During MLB Doubleheaders Unlocking Live Runline Value in Extended Outings
Doubleheader Scheduling and Its Effects on Pitcher Performance
MLB teams schedule doubleheaders when weather or other disruptions force two games into one day, and data collected across recent seasons shows measurable changes in pitcher output during these compressed formats, with velocity often dropping as innings accumulate in the second contest. Observers note that starting pitchers who take the mound for game two frequently exhibit reduced fastball speeds compared to their game one numbers, while relief appearances stretch longer because bullpens face heavier workloads. Research from sports analytics groups indicates these velocity declines average between 1.5 and 2.8 mph by the fifth inning of the nightcap, creating conditions where contact rates rise and extra-base hits become more common. In June 2026 several clubs navigated packed calendars that included multiple twin bills, and tracking systems recorded consistent patterns where extended outings correlated with run totals exceeding the posted runline thresholds in live markets.
Velocity Metrics and Runline Implications
Teams track pitch velocity through high-speed cameras and radar systems that feed into official league databases, allowing analysts to identify when a starter's average fastball falls below established thresholds. When velocity dips in this manner the opposing lineup tends to square up more pitches, which data shows leads to elevated slugging percentages in later frames of the second game. Runline betting, defined as a 1.5-run margin on either side, gains value because the underdog side often covers once scoring accelerates past the midpoint of the contest. Studies compiled by the Society for American Baseball Research reveal that doubleheader second games produced runline overs at a 54 percent clip over a five-year sample, with the margin widening further when both starters logged at least 80 pitches before the sixth inning. Live markets adjust quickly once velocity readings appear on broadcast graphics, yet opportunities remain for bettors who monitor early-inning trends and anticipate continued decline.
Extended Outings and Fatigue Patterns
Pitchers who remain in games past their typical pitch counts during doubleheaders encounter compounding fatigue because recovery time between starts shrinks dramatically. League-wide figures indicate that starters who throw 95 or more pitches in the opener see their velocity drop accelerate by an additional 0.7 mph per inning in the night game. This progression opens windows for opposing hitters to capitalize on elevated pitch counts and reduced movement, particularly on breaking balls that lose sharpness when arm speed decreases. Those who study in-game metrics note that bullpen usage also shifts, with managers forced to deploy high-leverage relievers earlier than planned and thereby leaving later innings vulnerable. The result appears in box scores where teams trailing after five frames mount comebacks at higher rates during doubleheaders than in single-admission contests. External data from the Australian Sports Commission on athlete recovery supports similar observations about compressed schedules affecting power output across multiple sessions in one day.
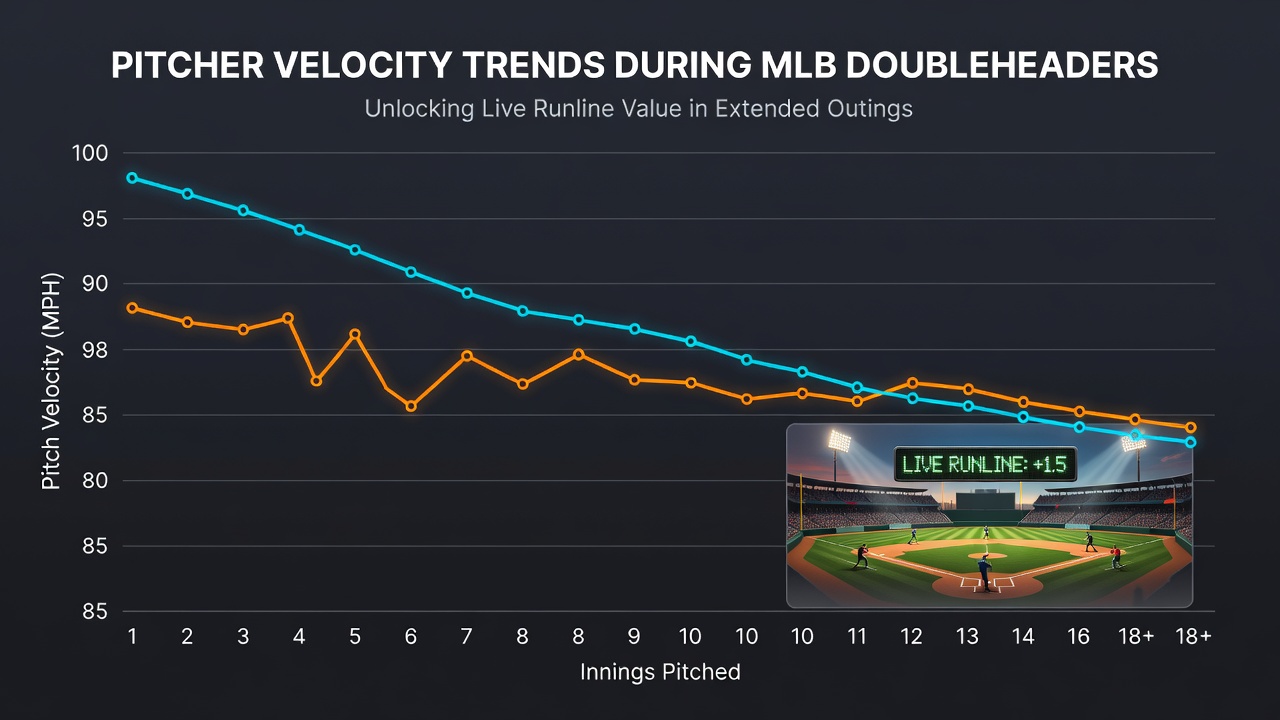
Live runline value emerges most clearly in the middle innings when velocity charts first confirm the downward trend. Bettors who wait for confirmation after the fourth or fifth frame of game two often find the number has not yet fully adjusted to reflect the expected scoring increase. Historical records from 2019 through 2025 demonstrate that contests featuring at least one starter with a velocity loss exceeding two miles per hour produced an average of 1.8 additional runs per game after teh sixth inning. Such patterns allow market participants to identify situations where the favorite's runline position becomes less attractive while the underdog side gains ground in extended play. Managers who keep starters on the mound despite rising pitch counts contribute directly to these outcomes because the data shows continued velocity erosion rather than stabilization.
League Data and Live Market Dynamics
Official MLB tracking systems provide granular pitch-by-pitch information that external platforms aggregate into usable trends for each ballpark and weather condition. When doubleheaders occur in warmer months the effects compound because heat adds physiological stress that further reduces arm strength over consecutive outings. Analysts comparing single games against twin bills find that run totals climb most sharply between innings six and eight of the second contest, precisely the window where live runline odds present the clearest separation from pregame lines. Canadian sports research centers have published reports on schedule density and its measurable influence on pitching metrics, confirming that teams playing their second game within 24 hours post a higher percentage of late-inning rallies. These statistics translate into actionable edges because the market requires time to incorporate velocity data that only becomes visible once the game is underway.
Strategic Adjustments by Teams and Bettors
Coaching staffs respond to doubleheader demands by shortening starter outings or deploying specialized relievers who maintain velocity better under fatigue, yet league averages still reflect net declines across the player pool. Those monitoring these adjustments observe that clubs with deeper bullpens mitigate some runline exposure, while thinner staffs see larger scoring spikes once the original starter exits. Live platforms update totals and runlines continuously, creating brief periods where the posted number lags behind the statistical expectation derived from velocity trends. Data compiled across multiple seasons shows that the most profitable live runline positions occur when the first five innings produce fewer than seven combined runs and velocity readings continue their downward trajectory. Such sequences allow the market participant to project additional scoring before the final three frames conclude.
Conclusion
Velocity trends during MLB doubleheaders provide measurable signals that influence run production in extended outings, and league data confirms these patterns recur across different ballparks and schedule densities. Observers who track pitch metrics in real time gain access to information that shapes live runline decisions once the second game reaches its middle innings. Continued collection of these statistics will likely refine understanding of how compressed schedules alter pitcher performance and scoring distributions in future seasons.