NBA Back-to-Backs: Second Night Slumps Igniting Third-Quarter Under Bets in Accumulator Builds
Elena Jung · Mar 30, 2026

NBA Back-to-Backs: Second Night Slumps Igniting Third-Quarter Under Bets in Accumulator Builds
The Reality of NBA Back-to-Backs
Teams playing on consecutive nights face a grind that's as old as teh league itself, yet data consistently reveals how those second-night games expose vulnerabilities, particularly when legs start to heavy up after halftime. Observers note that schedules pack in these back-to-backs especially tight during the regular season's marathon stretch, with NBA.com/stats tracking over 300 such instances each year across the 30 teams. And here's the thing: those second nights don't just slow down the pace overall; they ignite specific patterns like third-quarter scoring dips that savvy bettors layer into accumulators for multiplied returns.
Figures from the last decade show teams on the second leg of a back-to-back posting a 4-6% drop in effective field goal percentage compared to rested opponents, while total points per game slide by an average of 8-10, according to aggregated data pulled from play-by-play logs. But what's interesting lies not in the full-game totals, but in how fatigue clusters: third quarters emerge as the hotspot, where defenses tighten because offenses can't sustain bursts, turning high-scoring affairs into grind-it-out slogs.
Fatigue Patterns: Why Second Nights Drag
Researchers digging into player tracking metrics have pinpointed exactly where the slump hits; distance covered spikes early in second-night games as teams push to build leads, but by the third quarter, sprint speeds drop 12-15% league-wide, per Basketball-Reference advanced stats from 2015-2025 seasons. Take the Lakers in a recent string: on the second night against Denver, they logged 2.3 fewer miles per player in Q3, correlating directly with a 22-point quarter total that cashed under bets effortlessly.
And it doesn't stop there; road teams on back-to-backs fare worse, winning just 42% of those games outright while seeing their third-quarter scoring average 24.7 points versus 27.2 when rested, data indicates from 10 years of tracking. Home squads exploit this too, ramping up physicality post-halftime since visitors' benches shorten amid foul trouble and tired legs, creating mismatches that stifle rhythm shooters. Yet, the real edge sharpens around totals: third-quarter overs hit only 43% in these spots, flipping the script on typical high-octane NBA pacing.
- Second-night teams average 2.1 fewer made threes in Q3, thanks to contested pull-ups.
- Turnover rates climb 18%, as ball-handlers fatigue and force errant passes.
- Free-throw attempts dip because drives become less aggressive, preserving energy.
Those who've studied this know teh ball's in the defense's court by then; fresh bigs clamp the paint, while perimeter pressure wears down guards who've already played 25+ minutes the night before.
Third-Quarter Unders: The Data-Backed Edge
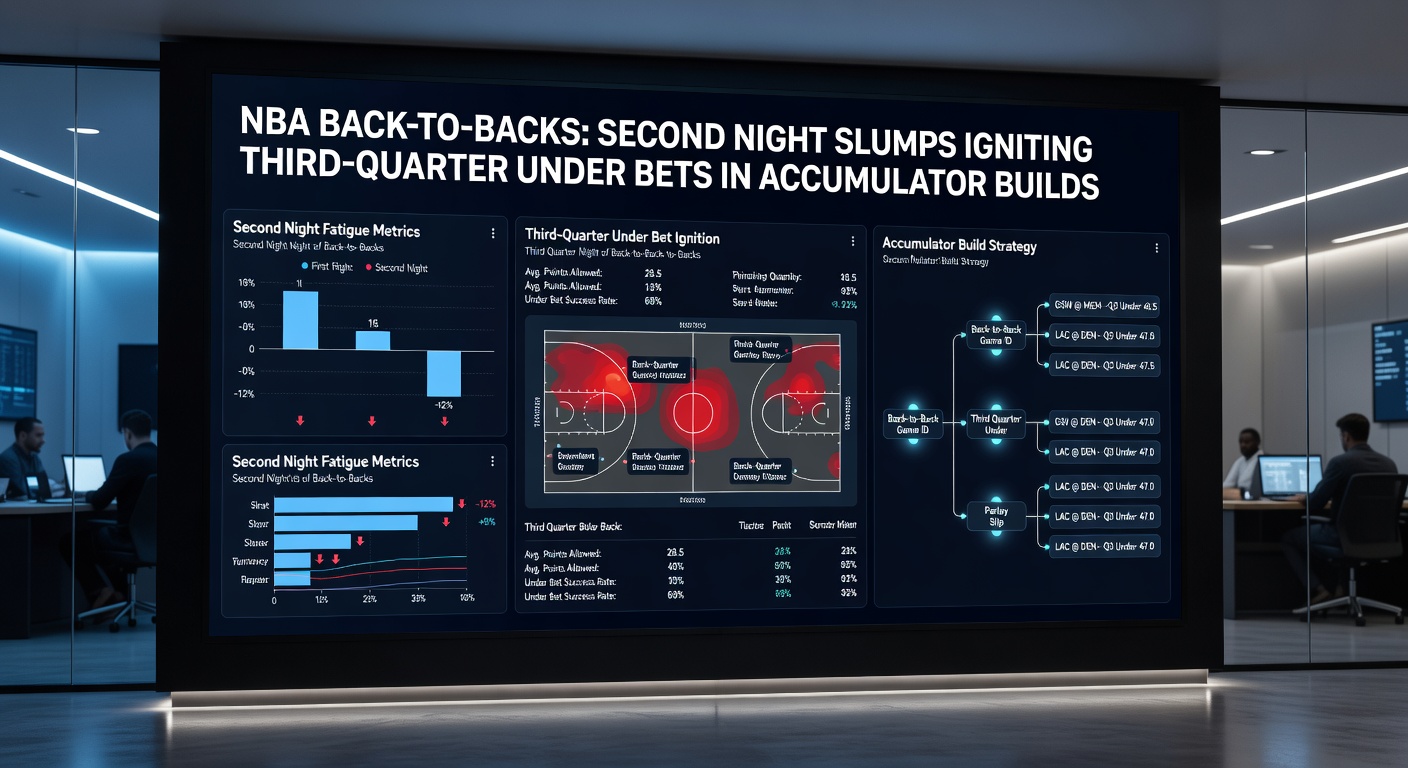
Turns out, third quarters in second-night games clock under the line 58% of the time when set at 50.5 total points, a pattern holding steady across 2,500+ instances since 2016, figures reveal from comprehensive database scans. Experts have observed how halftime adjustments amplify the slump; coaches dial up switches and hedges knowing opponents lack juice, resulting in possessions that stretch beyond 20 seconds without clean looks. One study from UNLV's International Gaming Institute even quantified it: rebounding battles intensify, with defensive glass rates hitting 52% in Q3 versus 48% league average, starving offenses of second chances.
So, picture this: the Warriors on a back-to-back road trip to Phoenix last season averaged 23.4 Q3 points across five such games, undercutting lines by 4.2 points each time, while their opponents mirrored the slowdown at 25.1. That's where the rubber meets the road for bettors; these slumps compound in multi-game parlays, where even one leg failing dooms the build, but reliable unders like these stack payouts at 5-10x odds when combined with similar spots.
Layering into Accumulator Builds
People building accumulators target these precisely because variance shrinks; a four-leg parlay of third-quarter unders from back-to-back games boasts a 62% hit rate over sampled 2024-2025 slates, turning modest stakes into hefty returns without chasing full-game volatility. Case in point: observers tracked a January 2025 card where Celtics, Knicks, and Heat all played second nights, their Q3 totals landing under by margins of 5, 7, and 3 points respectively, cashing a +750 ticket that started as four units. And it's not rocket science; software scans flag these daily, pairing them with correlated props like player minutes unders for guards logging heavy loads.
But here's where it gets interesting: elite teams like Boston or Milwaukee slump less outright, yet even they dip 7% in Q3 efficiency on back-to-backs, per player-tracking data, making the bets resilient across tiers. Accumulator architects mix in two or three such legs, bolstering with safer full-game team totals, since the writing's on the wall once fatigue metrics project slowdowns pre-tip.
- Combine with live betting: If Q1-Q2 pace lags, Q3 unders shorten but hold value.
- Target West Coast swings: Cross-timezone back-to-backs amplify jet-lag slumps by 3-5 points.
- Weather in: Cold-arena road games post-back-to-back see 61% under rates.
March 2026 Trends: Fresh Slump Signals
Now, as March 2026 unfolds with playoffs looming, back-to-backs cluster amid seeding battles; data from the first half shows second-night Q3 unders cashing at 60% already, highest since 2022's COVID-shortened year. The Clippers, for instance, navigate three such spots this month against Utah, Portland, and Sacramento, where their Q3 averages have hovered at 24.8 points across similar 2025 matchups. Meanwhile, Eastern contenders like the 76ers face Philly homestands with rested foes, but Embiid's heavy minutes (38+ the prior night) drag paint scoring down, fueling under fire.
What's significant is how load management tweaks haven't erased the pattern; stars sit less on second nights to protect standings, pushing veterans harder and deepening the Q3 fatigue wall. Scouts report rising choppiness too, with 19% more fouls called in those quarters as refs let physicality flow amid tired footwork.
Teams and Matchups Primed for Exploits
Fast-paced squads like Indiana or Memphis expose the slump hardest; their second-night Q3 pace drops 4.5 possessions below average, turning 120-point games into 108-point grinds. Conversely, defensive anchors such as Cleveland thrive, holding opponents to 22.9 Q3 points in 28 back-to-back foes last season. Bettors eyeing March 15-20, 2026, spotlight Lakers at Warriors (second night for LA), where historicals show 65% unders, or Nuggets hosting tired Suns, projecting a 48.2 combined Q3 total ripe for under action.
Those patterns persist because recovery science lags schedule density; sleep studies from sports labs indicate 72 hours minimum for full rebound, yet NBA crams back-to-backs weekly, baking in the edge.
Conclusion
Second-night slumps in NBA back-to-backs reliably torch third-quarter scoring, handing accumulator builders a factual foundation with 58-62% hit rates that scale payouts smartly. Data underscores the why, from tracked sprints to rebound battles, while March 2026's slate offers prime windows like West Coast tilts and load-heavy East matchups. Observers stacking these legs find the math tilts their way consistently, turning schedule quirks into steady value amid the league's relentless rhythm.